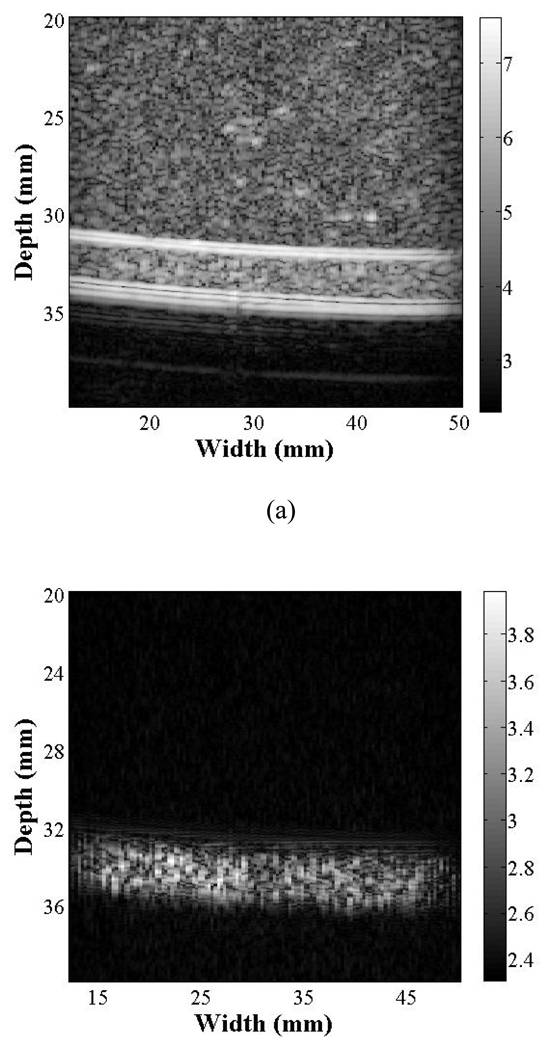
Fig. 7.
T7R7 (a) and T1R7 (b) images of control (non-targeted) microbubbles flowing through the flow phantom with an imaging pulse PNP of 250 kPa. The displayed grayscale ranges from the noise floor (~ equal in each case) to the peak post-filtered amplitude and the resulting dynamic range (DR) is ~70 dB for T7R7 and ~40dB for T1R7.

