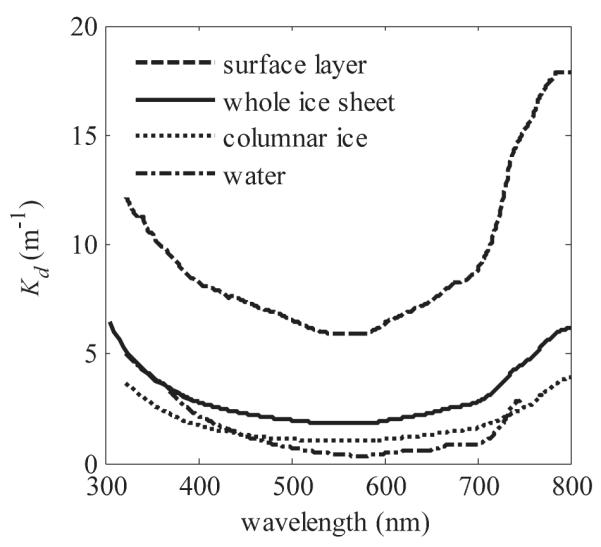
Fig. 4.

Calculated (surface layer) and measured (whole ice sheet, columnar ice, and water 20–70 cm below ice bottom, on 14 March) Kd. Entire ice thickness Kd shows the overlapping results from measurements with two different instruments (Ramses, 322–800 nm, and Macam, 305–400 nm, spectroradiometers; see text for details).
