Figure 2.
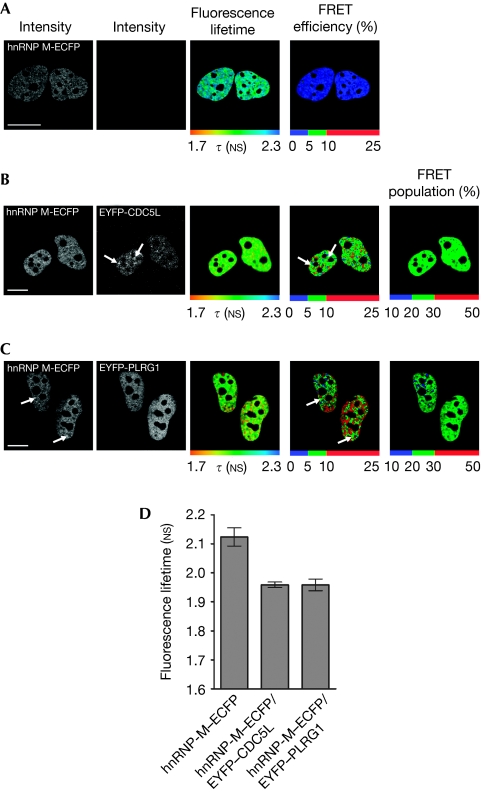
hnRNP-M interacts directly with CDC5L and PLRG1 in vivo. HeLa cells were transfected with hnRNP-M–ECFP (A) alone or in combination with either (B) EYFP-CDC5L or (C) EYFP-PLRG1 and analysed using the FLIM–FRET technique. The fluorescence lifetime τ (NS) was detected using the TCSPC method, and its spatial distribution was analysed using the SPCimage software. Fluorescence lifetimes are depicted using a continuous pseudo-colour scale representing time values ranging from 1.7 to 2.3 NS. The FRET efficiency percentage is calculated and depicted using discrete colours representing FRET values ranging from 0 to 25%. The FRET species (%) was quantified for both hnRNP-M–CDC5L and hnRNP-M–PLRG1 interactions. Scale bars, 10 μm. (D) Statistical analysis from three independent experiments in at least 15 different cells for each condition is presented. CDC5L, cell division cycle 5-like; ECFP, enhanced cyan fluorescent protein; EYFP, enhanced yellow fluorescent protein; FLIM–FRET, Förster resonance energy transfer–fluorescence lifetime imaging microscopy; hnRNP, heterogeneous nuclear ribonucleoprotein; PLRG1, pleiotropic regulator 1; TCSPC, time-correlated single photon counting.

