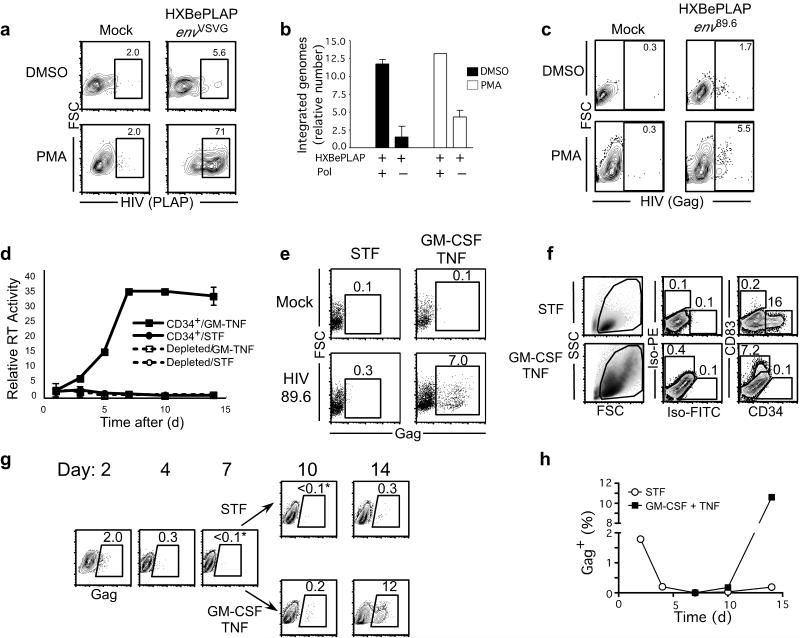
Figure 4.
Induction of HIV from latency. (a) The percentage of BM CD34+ HPCs (See Supplementary Fig. 2b for initial cell purity) expressing an HIV marker gene (PLAP) following infection with HXB–ePLAPenvVSVG plus or minus PMA. (b) qPCR 14 of integrated DNA from BM CD34+ cells infected and cultured as in (a). Pol–minus samples lack polymerase in the first round. Data are displayed as mean relative amount of integrated HIV DNA ± standard deviation (sd), n = 3. (c) The percentage of BM–derived CD34+ HPCs (Supplementary Fig. 2c) expressing intracellular Gag following infection with HXB–ePLAPenv89.6 plus or minus 10 ng ml−1 PMA. (d) Reverse transcriptase activity of CD34+ BM HPCs (Supplementary Fig. 2c) infected with HIV 89.6, plus or minus GM–CSF–TNF–α. The mean ± sd, n = 3 is shown. Control is BMMC immunodepleted for CD34. (e) Intracellular Gag expression 14 d post–infection for BM–derived HPCs infected and cultured as in (d). (f) CD34 and CD83 expression (right panels) after 2 weeks in CC110 or GM–CSF–TNF–α. Isotype–matched controls are shown (Iso–FITC and Iso–PE). (g) Intracellular Gag expression for BM–derived HPCs (Supplementary Fig. 2e) infected with HIV 89.6 and cultured in CC110 cocktail. On day 7, the cells were divided either into CC110 cocktail or GM–CSF–TNF–α. Asterisks indicate Gag reactivity < mock treated cells. (h) Graphical representation of the experiment depicted in part (g).

