
Figure 3.
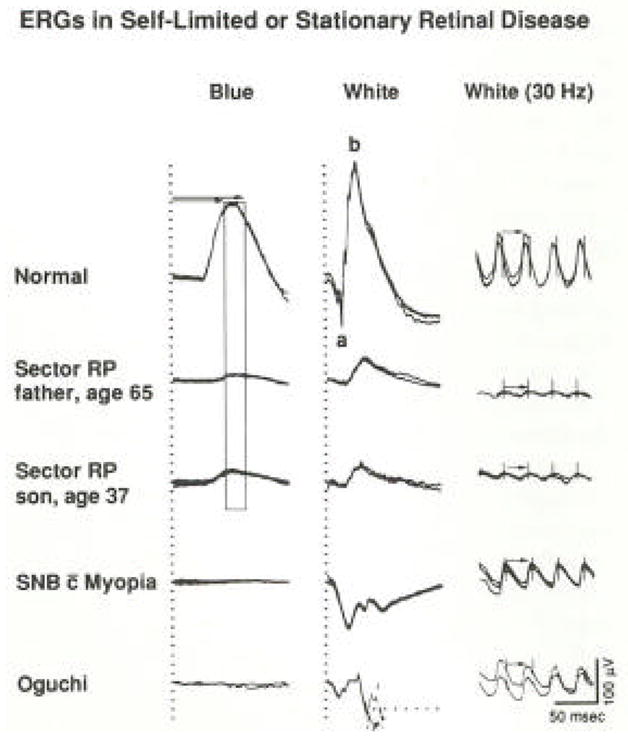
Full-field ERG responses from a normal subject and four patients with self-limited sector retinitis pigmentosa or stationary forms of night blindness. Horizontal arrows (column 1) designate range of normal rod b-wave implicit times, and vertical bar defining this range (mean ± 2 SD) has been extended through responses of patients with sector retinitis pigmentosa. Responses (middle column) from patient with Oguchi’s disease are interrupted by reflex blinking, so latter part cannot be illustrated. Cone implicit times in column 3 are designated with arrows. (From Berson, 1976.)