
Figure 4.
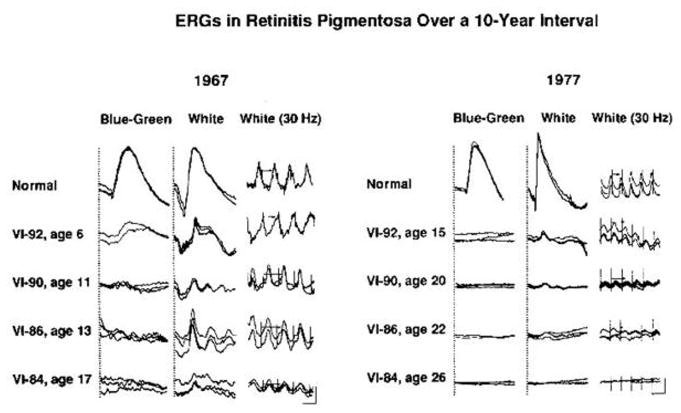
Full-field ERG responses recorded in 1967 and 1977 from a normal subject and from four affected members of a family with a dominant form of retinitis pigmentosa. Pedigree number and age at time of testing are indicated for each patient. One to three responses to the same stimulus are represented. Calibration symbol for 1967 responses designates 50 msec horizontally for columns 1 and 2 and 25 msec for column 3 and 50 μV vertically for column 1 and 100 μV vertically for columns 2 and 3. Calibration symbol for 1977 responses designates 60 msec horizontally and 100 μV vertically for all tracings. (From Berson and Simonoff, 1979.)