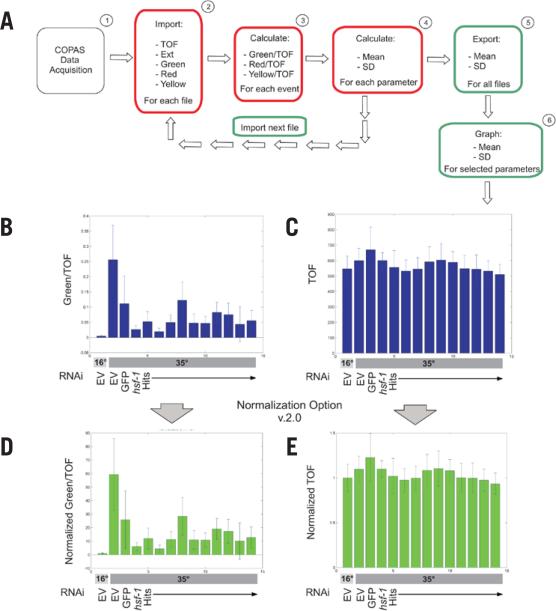
Figure 2. Data analysis flowchart for COPAquant analysis of single-sample mode data.
(A) Data flow is diagrammed for extraction of mean and sd of particular parameters from COPAS files. Red boxes represent tasks completed by the function COPASFun, while green boxes represent COPASImp tasks. (B) MATLAB was used to quantify fluorescence in an RNAi screen for suppressors of hsp-16p::GFP expression after heat-shock (35°C). Empty vector (EV) RNAi represents the negative control before and after heat shock. GFP and hsf-1 RNAi represent the positive controls for clones that decrease expression. HSF-1 is a transcription factor that promotes hsp-16.2 expression. Hits are RNAi clones identified as repressing reporter expression in our screen. Values were normalized to TOF. (C) TOF values for the same samples as in panel B were graphed. (D and E) COPASFun version 2.0 normalizes each event value to the mean of the 16°C EV control and returns the new means and standard deviations. Shown are the normalized graphs for the data in panels B and C. For all conditions, n ≥ 41.

