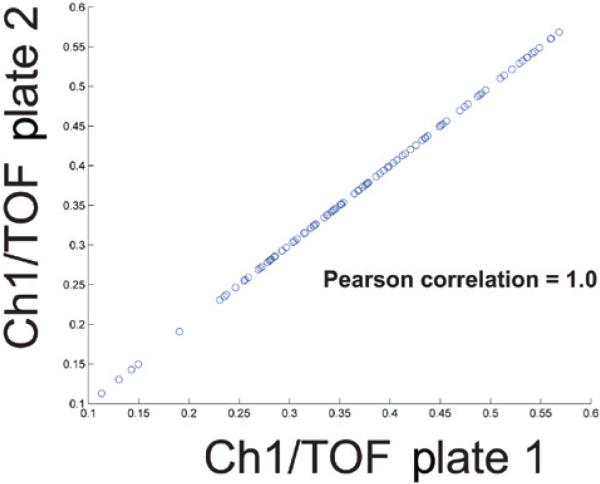
Figure 5. Two plate comparison using COPAcompare.
Screen shot of the results from a hypothetical COPA-compare two plate comparison. Two identical hypothetical ReFLX files were compared with one another, resulting in a calculated Pearson correlation coefficient of 1. The calculated Pearson Correlation is displayed within the MATLAB command console, as illustrated in our online tutorials (www.med.upenn.edu/lamitinalab/downloads.shtml). Each point on the graph represents a single well, with the x-coordinate representing data from plate 1 and the y-coordinate representing data from plate 2. Overall correlation was determined using the Pearson Correlation function within the MATLAB library.

