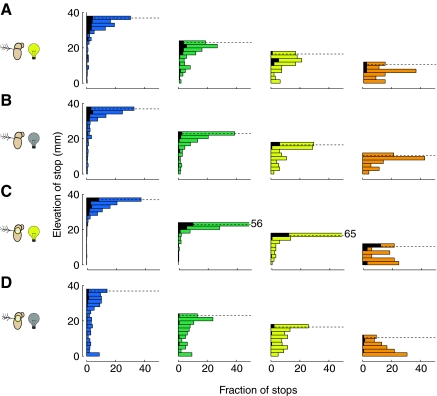
Fig. 11.
Flies tend to stop at the top of the cones. Horizontal bar graphs show the fraction of all stops (colored) and long stops (black) that were performed at a given elevation. Each column represents the stops on a given cone type, color code as in Fig. 1F. The dashed black line in each column is the height of the top of that cone; stop elevations can be taller than the height of the cone because we included the flies' body height (1 mm) in our 3-D model. Each row is a different sensory condition: (A) intact flies in the light (N=25), (B) intact flies in complete darkness (N=25), (C) flies with antennae immobilized in the light (N=40) and (D) flies with antennae immobilized in complete darkness (N=40). In C, the top bin of the green and yellow histograms is truncated at 50% for presentation purposes; the real values are 56% (green) and 65% (yellow).

