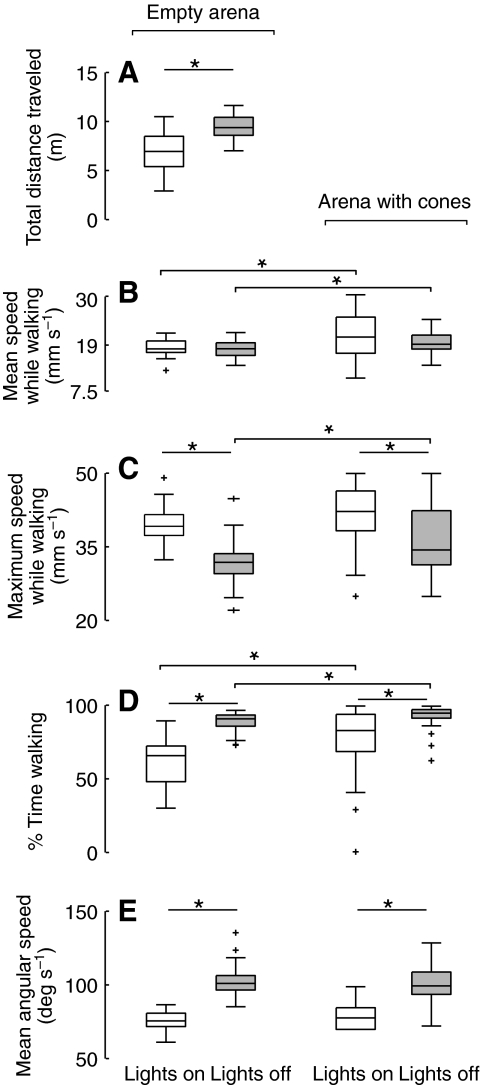
Fig. 3.
Visual information influences the basic statistics of walking. The two leftmost box plots in each panel show data for flies exploring an empty arena in the light (white, N=33) and in the dark (gray, N=33). The two rightmost box plots show data from flies exploring the floor of the arena with cones present in the light (white, N=45) and in darkness (gray, N=45). (A) The total distance traveled by individual flies during a 10 min trial. (B) The mean speed while the flies were walking. (C) The maximum speed calculated while the flies were walking. (D) The percentage of time the flies spent in the walking state, normalized for the total time spent on the floor of the arena when cones were present. (E) The mean angular speed calculated while the flies were walking. Statistically comparisons were made using heteroscedastic two-sample t-tests unless the data were not normally distributed in which case the Mann–Whitney U-test was used (C,D). Asterisks indicate significantly different distributions (P<0.05 with Bonferroni correction) between the indicated pairs of data; crosses denote outliers.

