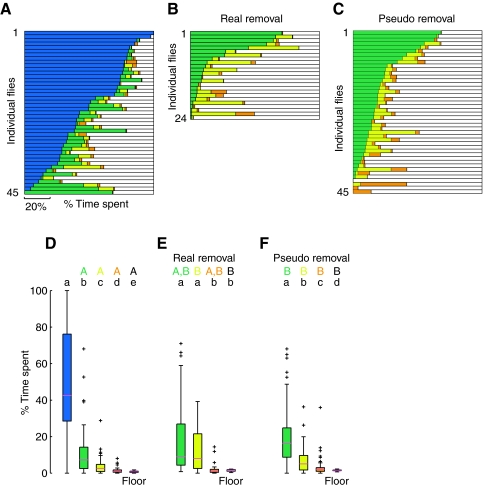
Fig. 4.
Flies spend more time on tallest, steepest cone. Color-coded (see Fig. 1F) horizontal bar graphs show the percentage of the 10 min trial that each fly spent on the four cones and the floor of the arena (white). The data are ranked by the time spent on the blue (A) or green (B,C) cone. (A) Data for trials with all four cones present (N=45). (B) Data from trials in which the tallest, steepest (blue) cone was removed from the arena (N=24). (C) ‘Pseudo removal’ data created by scaling the data from (A) after excluding visits to the blue cone (see text for details; N=45). (D–F) The distributions of the data in A, B, and C respectively, are shown after normalizing for area of the surfaces being explored. The results of statistical tests are indicated with a letter code; groups labeled with the same letter are not statistically different and a group can have more than one label, indicating that group(s) with any of the same letter are not significantly different (for more details see methods). Across trial statistical tests compare a given cone type across experimental conditions and the results are denoted with uppercase letters of the color indicating the cone type being compared (color code from Fig. 1F and uppercase black letter=arena floor). Comparisons were made using a Mann–Whitney U-test with Bonferroni correction, P<0.05. Within trial statistical tests compare the different cone types in a given experimental condition and homogenous groups are denoted with lowercase black letters. Comparisons were made using Wilcoxon's signed-ranks test with Bonferroni correction, P<0.05.

