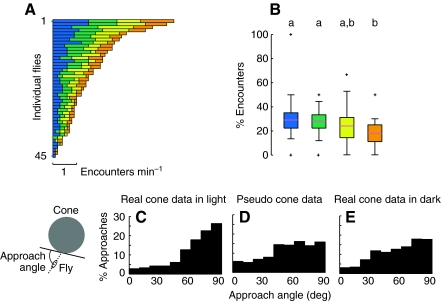
Fig. 5.
Flies encounter objects of differing geometry at similar rates. (A) Horizontal bar plots indicate the encounter rates of each cone type for each fly, ranked according to total encounter rate. (B) Box plots show the percentage of encounters for each cone type (N=45). See Fig. 1F for color code. The Wilcoxon signed rank test for non-independent, non-normal data was used to compare groups (P<0.05 with Bonferroni correction for multiple comparisons). See Fig. 4 for explanation of letter codes for homogeneous groups; crosses denote outliers. (C) The frequency distribution of approach angles to all cone types in the light. (D) The frequency distribution of approach angles to pseudo cones footprints created from the data set in which no cones were present. (E) The frequency distribution of approach angles to all cone types in the dark.

