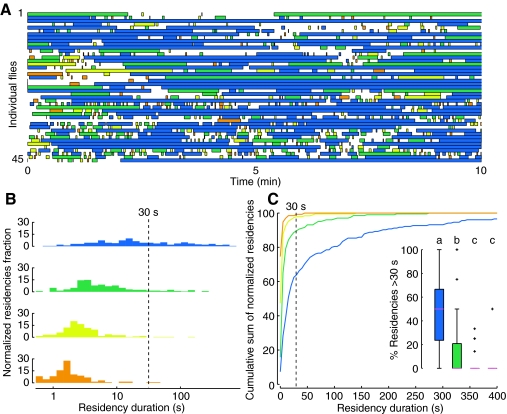
Fig. 6.
Flies exhibit long residency times on the tallest, steepest cone. (A) Each row represents the time series data of a single fly (N=45). The color (see Fig. 1F) indicates the identity of the cone the fly resides on and white spaces indicate periods spent on the arena floor. (B) Normalized frequency distribution of log of the residency durations by all flies on each cone type from data plotted in A. (C) Cumulative sums of the normalized frequency distribution of all residency durations by all flies. The inset shows the distribution of the percentage of individual flies' residency times longer than 30 s. Statistical comparisons were made using a Kolmogorov–Smirnov two-sample test (P<0.05, with Bonferroni correction); crosses denote outliers. See Fig. 4 for explanation of letter codes for homogenous groups.

