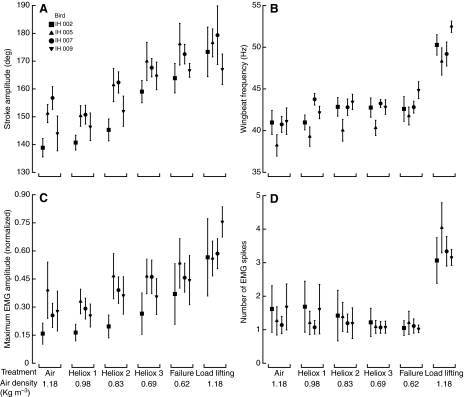
Fig. 4.
Regulation of wingbeat kinematics [(A) stroke amplitudes; (B) wingbeat frequencies] and electromyogram (EMG) features [(C) maximum EMG spike amplitude; (D) number of EMG spikes per excitation] in relation to experimental treatments. Treatment densities represent median values. Symbols represent means (±s.d.) of individual hummingbirds. Over the course of several hours, hummingbirds were recorded hover feeding in air, across decreasing air densities and during maximum load lifting. Note that EMG spike amplitudes are normalized such that the single highest spike for each individual across all trials would have a value of 1.

