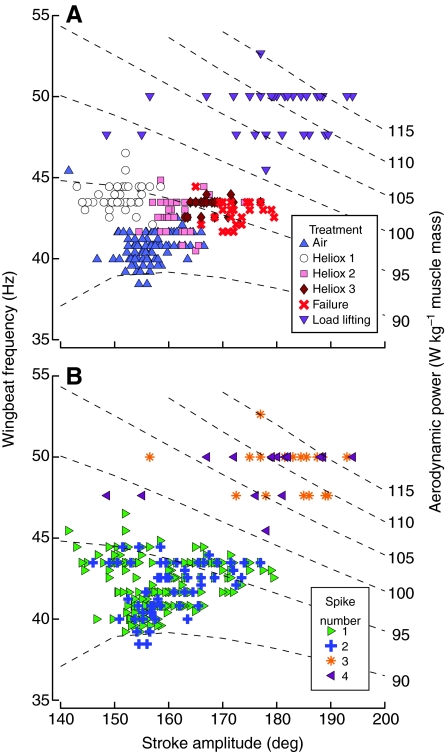
Fig. 5.
Wingbeat frequency as a function of stroke amplitude in an individual Anna's hummingbird (IH 007). Each point represents the values for a single wingbeat in each of six behavioral treatments (A). The same data are replotted with new symbols and a new color map representing the number of spikes per excitation burst within the wingbeat (B). The broken lines represent the aerodynamic power isoclines, with power expressed in watts per kilogram of muscle mass listed on the right-hand side of each line. The isoclines assume normal body mass and thus do not include the additional requirements from added weights in the load-lifting trial.

