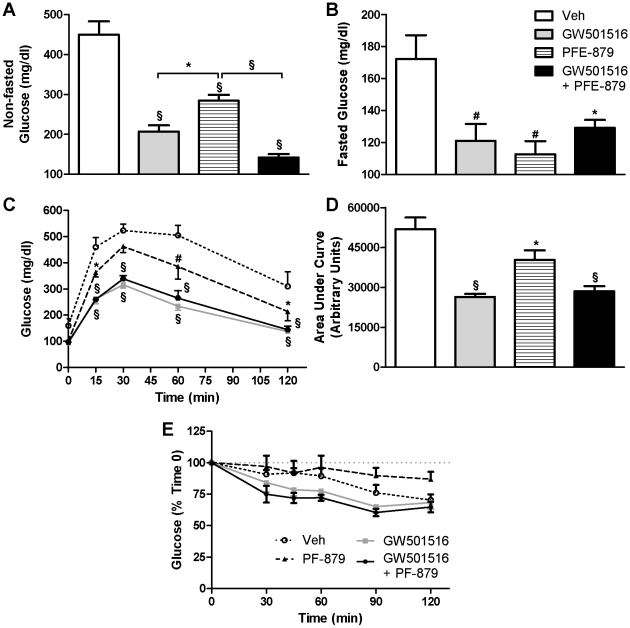
Figure 3. PPARδ activation and myostatin inhibition improve glucose homeostasis and tolerance in ob/ob mice.
Following 6 weeks administration of vehicle (Veh), GW501516, PF-879, or GW501516 concurrent with PF-879, non-fasted (A) and fasted (B) glucose concentrations were measured. Blood glucose concentrations before and 2 hours after a bolus of glucose were measured following an overnight fast (C) and area under the glucose curve was calculated (D). Changes in glucose concentrations in response to a bolus of insulin were measured following a 4 hr fast (E). Data are represented as mean +/− SEM (n = 10/group). *, # and § denote p<0.05, 0.01 and 0.001, respectively.

