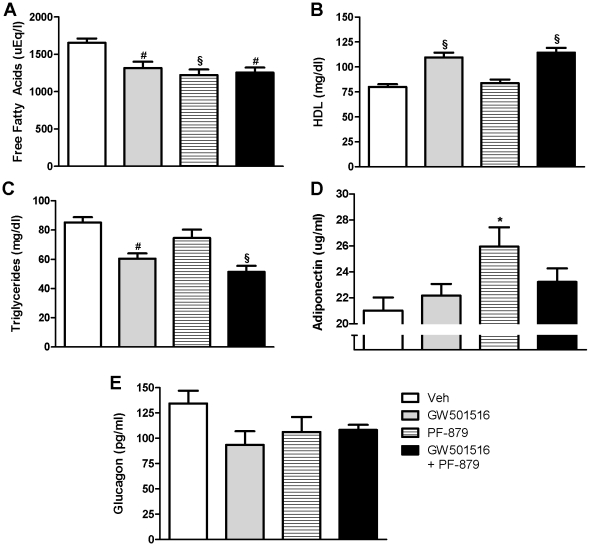
Figure 5. PPARδ activation and myostatin inhibition improve the lipid profile and alter adiponectin in ob/ob mice.
Serum lipids were analyzed following 6 weeks treatment with vehicle (veh), GW501516, PF-879, or GW501516 in combination with PF-879. Free fatty acids (A), high density lipoproteins (HDL) (B) and triglycerides (C) are illustrated. Circulating adiponectin levels (D) and glucagon concentrations (E) are also summarized. Data are represented as mean +/− SEM (n = 10/group). *, # and § indicate p<0.05, 0.01 and 0.001, respectively. See also Figure S2.

