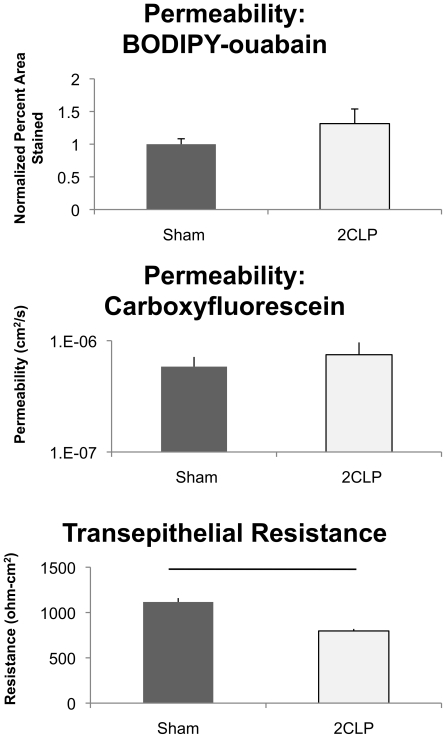
Figure 6. Permeability analysis of monolayers from sham and 2CLP animals.
(Top) Monolayer permeability to the molecular tracer BODIPY-ouabain (∼20 Å) is shown normalized to the percent area stained in the sham monolayers. No significant differences were observed. (Middle) Monolayer permeability to the small molecular tracer Carboxyfluorescein (∼5 Å) was not significantly different between the two groups. (Bottom) Transepithelial resistance measurements show significant (p<0.05) differences between groups, and indicate that the 2CLP monolayers are more permeable to ions. (mean ± SE).

