Figure 5.

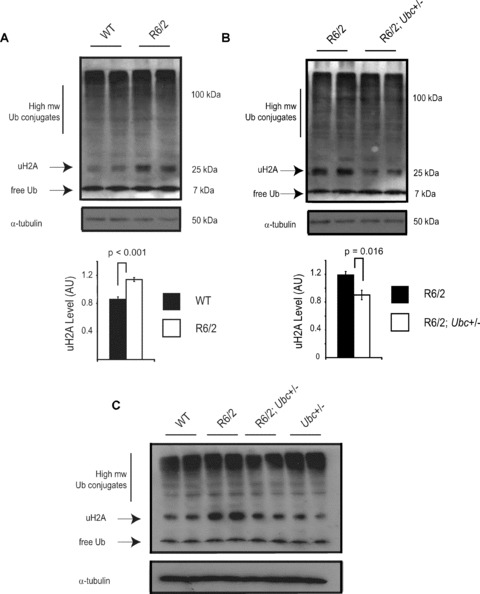
Ubiquitin profiles reveal an increase in monoubiquitylated histone H2A (uH2A) levels in R6/2. (A) Western blot with anti‐ubiquitin antibody confirms there is no difference in free ubiquitin or high molecular weight ubiquitin conjugates in the R6/2 brain. Interestingly, the intensity of the 25‐kD band corresponding to monoubiquitylated histone H2A (uH2A) is significantly increased in R6/2 mice as confirmed by densitometry. Western blotting with a specific H2A antibody showed that non‐ubiquitylated H2A levels were lower in R6/2 mice, in keeping with increased uH2A levels (data not shown). The blot was reprobed with α‐tubulin to confirm equal loading. (B) The increase in uH2A levels in R6/2 brains is reduced in brains of R6/2; Ubc+/− mice as shown by Western blot and densitometry. (C) Increased H2A monoubiquitylation is also observed in 8‐week R6/2 mice but not in R6/2; Ubc+/− mice. Blots were reprobed with α‐tubulin antibody. It should be noted that detection of high molecular weight ubiquitin conjugates in Fig. 5 differs to that depicted in Fig. 4. The lysis buffer used for the Western blot in Fig. 5 is incompatible with Usp2‐cc activity, and immunoprobing with the anti‐ubiquitin antibody does not work as effectively in the buffer used for Usp2‐cc digestion (Fig. 4). Error bars represent standard errors of the mean.
