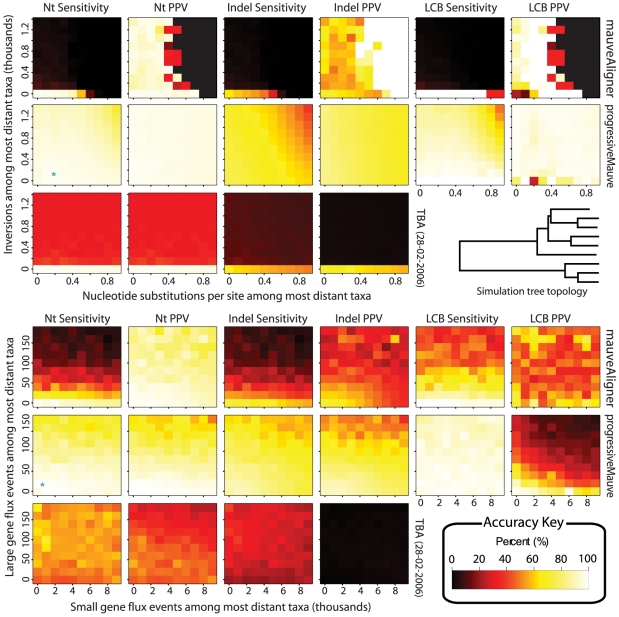
Figure 6. Accuracy of mauveAligner, progressiveMauve, and TBA when aligning genomes with inversions and segmental gain and loss.
In the experiments shown at top, the inversion rate increases along the  -axis and the substitution rate along the
  -axis. The most distant taxa have 0.05 indels per site. progressiveMauve clearly outperforms mauveAligner 1.3.0 over the entire space of inversion rates. It should be noted that in applications such as the UCSC browser alignments TBA was used in conjuction with a separate synteny-mapping method to identify rearrangements [66], so the performance results given here are not cause for alarm. Experiments at bottom quantify aligner performance in the presence of small- and large-scale gain and loss events. The
  -axis gives the average number of large gain and loss events [length
 Unif(10kbp, 50kbp)] between the most distant taxa, while the
  -axis gives small gain and loss events [length
 Geo(200bp)]. Substitution and indel rates are those indicated by the asterisk in Figure 5, and the most distant taxa have 42 inversions on average. The asterisk in this figure indicates a simulation scenario expected to be similar to our 23 target genomes. Once again progressiveMauve outperforms other methods, but all methods break down when faced with substantial large-scale gain and loss. Of note, when mauveAligner 1.3.0 attains high PPV it usually does so with very poor sensitivity.

