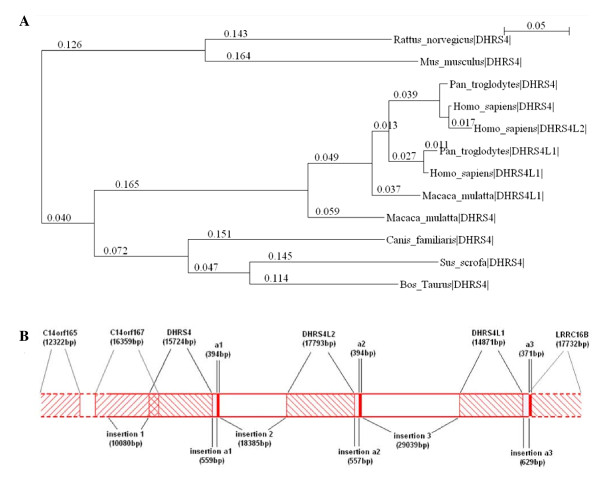
Figure 1.
The homologous comparison of DHRS4 gene cluster. (A) Evolutionary relationships of DHRS4, DHRS4L2 and DHRS4L1 among various species. The phylogeny of DHRS4, DHRS4L2 and DHRS4L1 is shown as a neighbor-joining tree with bootstrap. The scale bar represents 5% sequence divergence. Positions of genes in the corresponding species are shown as vertical hatches. Horizontal bars and the values on them represent the length of the DNA sequence after alignment. (B) The context and composition of the human DHRS4 gene clusters.

