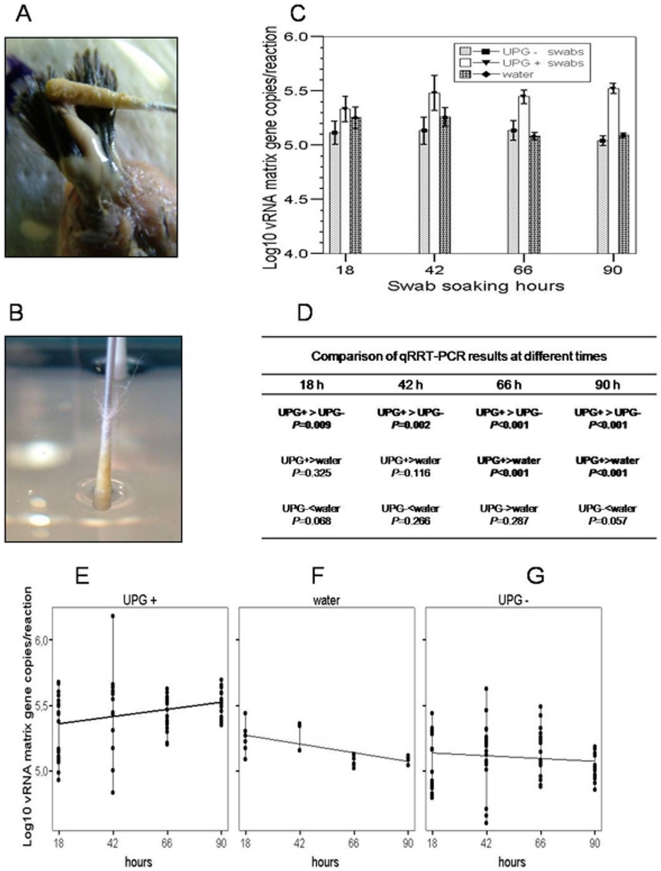
Figure 3. AIV capture from AIV-contaminated fresh water and concentration on preen oil impregnated swabs.
(A) Swabs impregnation with preen oil (UPG+). (B) Swabs soaked in AIV-contaminated water. (C) Bar graph representing mean ±2 SEMs of log10 of vRNA M gene copies per reaction calculated at each interval time from 3 preened (UPG+) swabs and 3 unpreened (UPG–) swabs that were soaked in AIV-contaminated fresh water; the contaminated fresh water samples were used for comparison. (D) Pair comparison of qRRT-PCR results. Bold type indicates significant differences calculated by 2-tailed Student's t-test. (E–G) Relationship between log10 of vRNA M gene copies detected in (E) UPG+ swabs with respect to swab-soaking hours, (F) water with respect to water-collection hours, (G) UPG– swabs with respect to swab soaking hours. UPG+ and UPG–: Swabs impregnated with preen oil and non-impregnated Swabs, respectively.

