Figure 1.
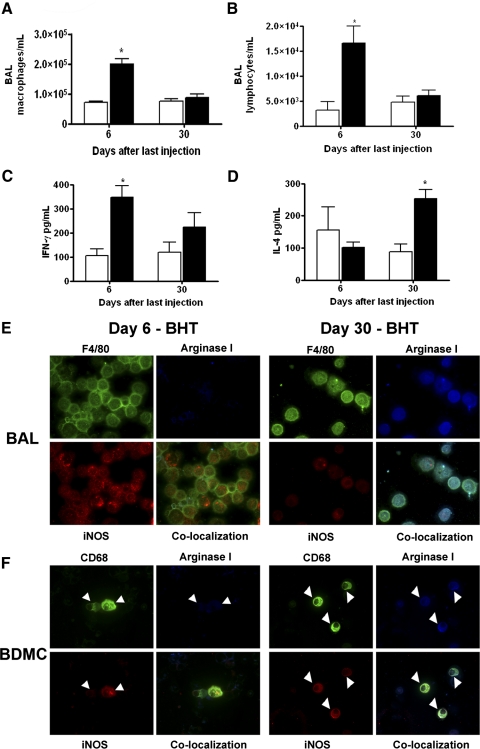
Cellular infiltration and cytokine contents in pulmonary BAL change after BHT administration. (A) BAL macrophage content increases 6 days following the last of four weekly BHT injections. By 30 days after the last injection, population size has returned to basal levels. (B) Lymphocytes display similar population kinetics, rising at the 6-day time-point and returning to control levels by Day 30. (C) IFN-γ levels rose above control (open bars) 6 days after chronic BHT exposure and then declined by 30 days. (D) IL-4 levels 6 days after BHT are similar to corn oil controls but increase by Day 30. Data represent the mean ± sem. *, P < 0.001, compared with control; n = 5. Mice treated with corn oil control (open bars); mice treated with BHT (solid bars). (E) BAL macrophages (F4/80, green) express iNOS (red) but not arginase I (blue) 6 days after chronic BHT (upper row). (F) BDMCs (CD68, green, white arrowheads) also express iNOS but not arginase I 6 days after BHT (E and F). BAL macrophages and BDMCs (white arrowheads) from mice 30 days after chronic BHT administration are argIhigh-iNOShigh (lower rows). Final original magnification, ×630.

