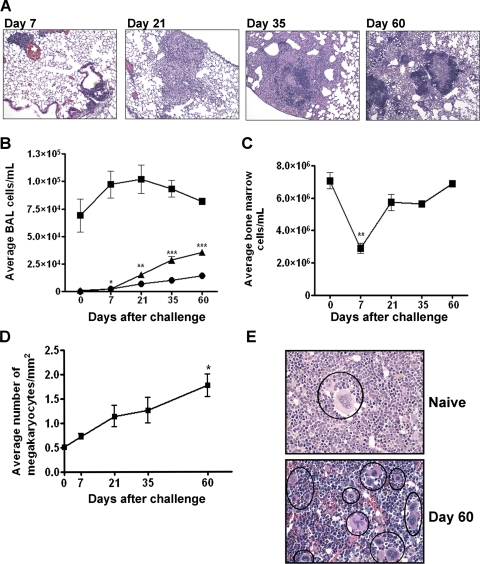
Figure 3.
M. tuberculosis pathogenesis in mice. (A) Granuloma progression after M. tuberculosis infection. (B) BAL macrophage (▪) numbers rise and fall slightly, and lymphocytes (▴) and neutrophils (•) increase steadily. (C) The BM cell population decreases shortly after bacterial exposure but returns to normal levels by 60 days after infection. (D) The number of megakaryocytes increases during M. tuberculosis infection. (E) There are fewer megakaryocytes (black circles) in the marrow of naïve mice compared with BM from a mouse 60 days post-challenge. Data represent mean ± sem; n = 6; *, P < 0.05; **, P < 0.01; ***, P < 0.001, compared with control.

