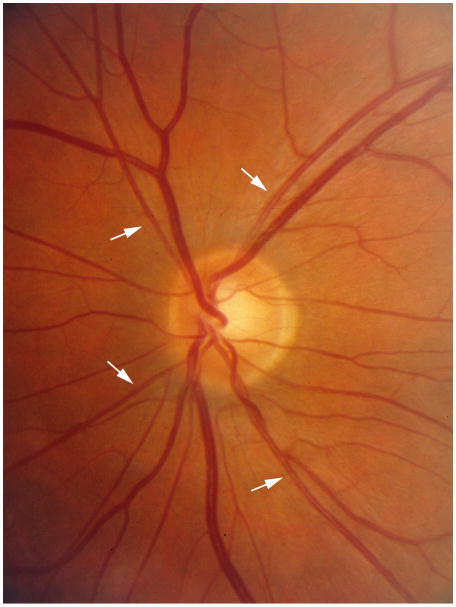
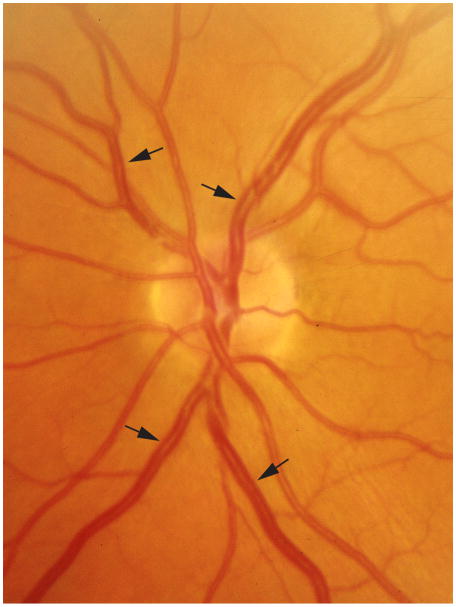
Figure 2.
a. Retinal image of left eye showing narrow retinal arterioles (white arrows, CRAE 99:m, mean and standard deviation in the RASS 159±13:m) and normal retinal venules (CRVE 222:m, mean and standard deviation in the RASS 228±22:m) and b. Retinal image of a left eye showing wide retinal venules (black arrows, CRAE 177 :m, CRVE 304 :m) and normal retinal arterioles.


