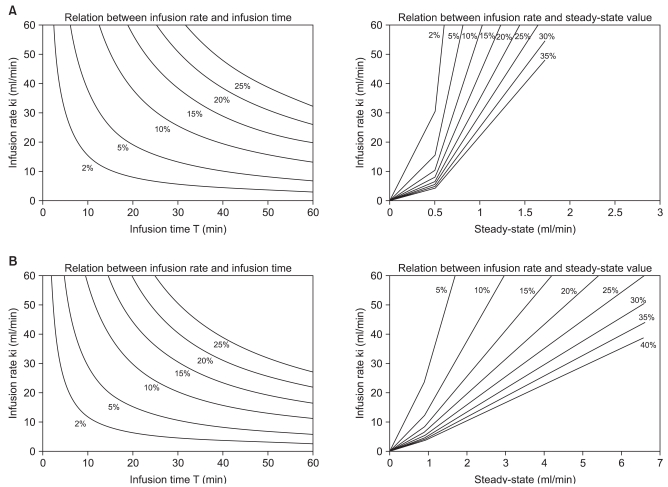
Fig. 4.
Infusion strategy nomogram showing (left) the relationship between infusion rate and infusion time and (right) the infusion rate required to maintain a steady-state dilution, estimated from both infusion rate and infusion time during the first phase, with reference to Hextend infusion after mild hypovolemia (400 ml) in wakeful (A) and anesthetized (B) individuals.

