Figure 10.
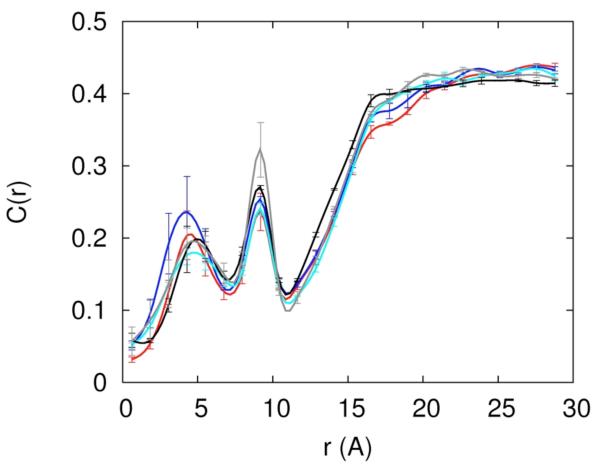
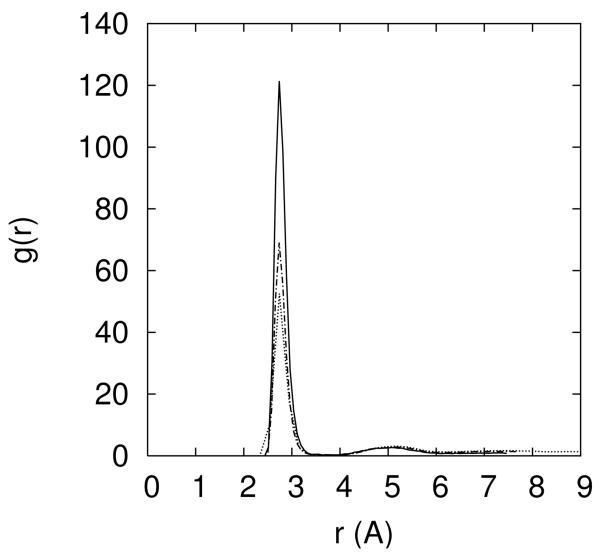
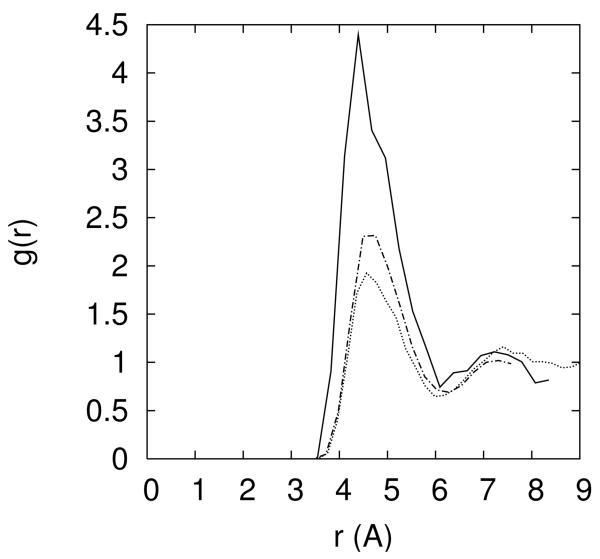
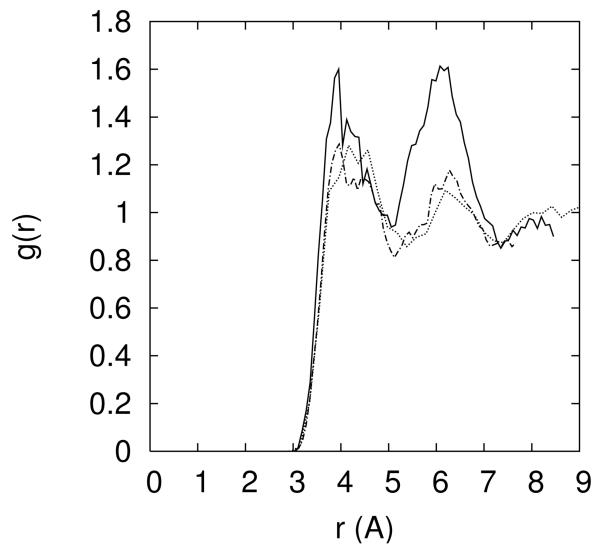
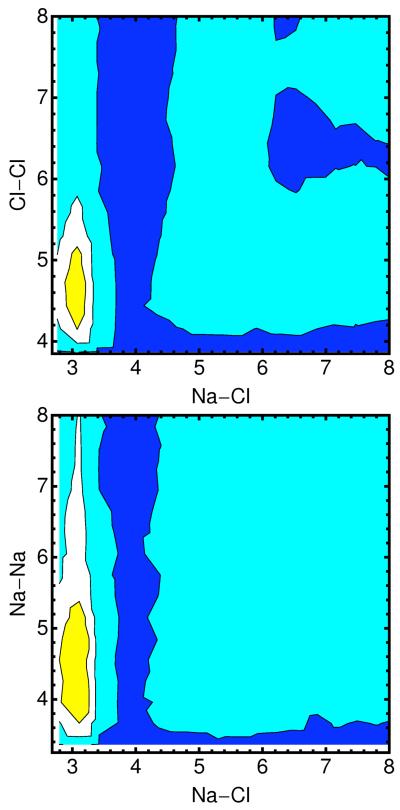
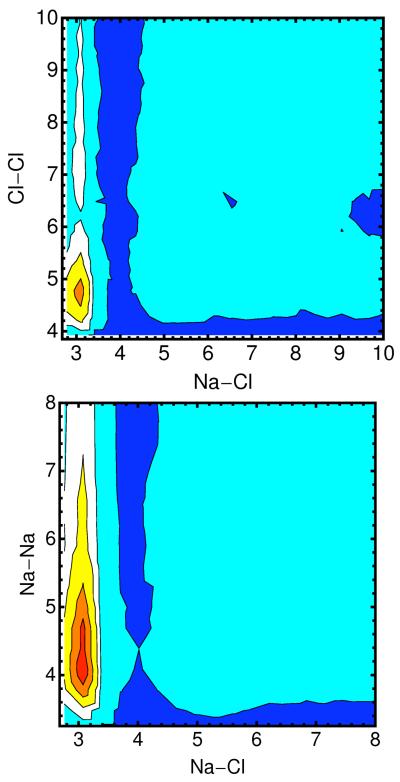
10.a -The distribution of the Cl− ion as a function of distance from the line of center of the RNA for different ionic solutions (0.4M NaCl – red; 0.05M MgCl2 and 0.3M NaCl -- blue; 0.1M MgCl2 and 0.2M NaCl – cyan; 0.15M MgCl2 and 0.1M NaCl – black; 0.2M MgCl2 – gray). 10.b Distance pair correlation function of Na+ and Cl− plotted for three cases: (i) both ions are near the RNA and each of their distances is smaller than 15Å (solid line), (ii) both ions are reasonably far from the RNA (r>15Å), and (iii) pair correlation function extracted from a 0.4M solution of NaCl (dashed-dot). Note that the bulk distribution is very similar to distribution (ii) – ions that are at least 15Å away from the RNA. 10.c – the same as 10b but this time for the correlation between two chloride ions. 10.d – the same as 10b but this time for the correlation between two sodium ions. 10.e- two dimensional pair correlation function is defined where < Ni(r1)Nj(r2) > is the time average of total number of ion i found between r1 and r1 + δri and at the same time the total number of ion j found between r2 and is the bulk density of ion k. Pair correlation between Na-Cl–Cl-Cl and Na-Cl – Na-Na is plotted for ions far from the RNA (r>15Å) with a contour coloring showing the function gas blue 1, cyan 20, white 50, yellow 100, orange 150 and red 200. 10.f Same as 10.e this time ions are close (r<15Å).

