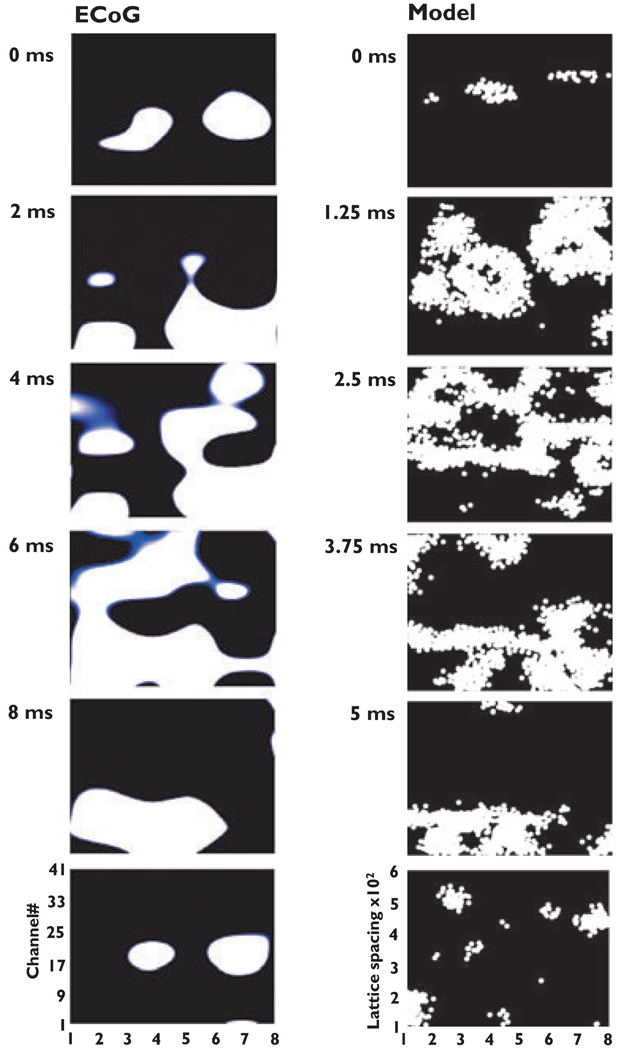
Figure. 2.
Comparison of spatiotemporal patterns in electrocorticography (ECoG) data and in cellular automaton model data. The left shows successive frames of activity, every 2 ms, from an 8 × 6 subdural array of electrodes (see Methods), in Patient B of Roopun et al. (2009). The right shows frames of activity every five time steps (i.e., every 1.25 ms) from a cellular automaton model with 480,000 cells in an 800 × 600 array, with mean index <i> 1.33, cr = 25 lattice spacings, pspon = 1.25 × 10⁻⁵.Videos of ongoing ECoG and model data are in Supporting Information.

