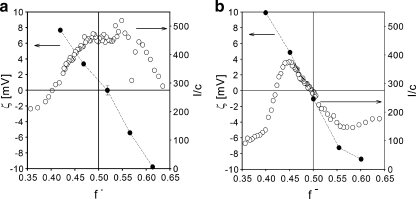
Fig. 4.
Formation of C3Ms in bulk as measured with DLS titrations and zeta potential measurements. Left Y axis zeta potential, right Y axis scattering intensity [kilohertz] divided by the total concentration, c [grams per liter], of the polymer. Symbols: open circle DLS titration curves of PAA21-b-PAPEO14 with P2MVPI43 (a) and P2MVPI228 (b) in 10 mM NaCl, pH 7, closed circle zeta potentials of C3M-PAPEO14/P2MVP43 (a) and C3M-PAPEO14/P2MVP228 (b) measured at various mixing ratios (f -) in 10 mM NaCl, pH 7. Lines were added to guide the eye

