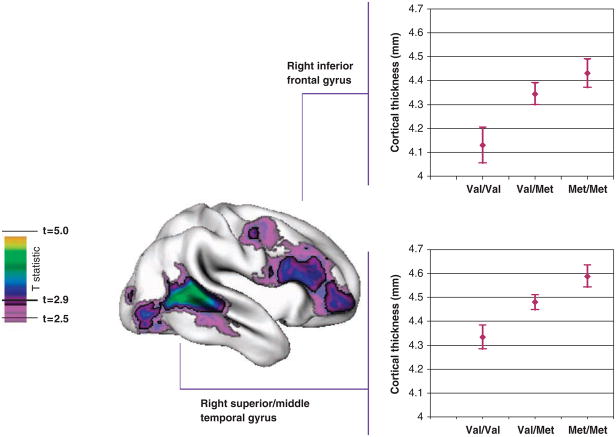
Figure 1.
T statistics are projected onto a brain template (right lateral view) that shows the regions with a linear increase in cortical thickness where Val158Val < Val158Met < Met158Met. Regions in pale purple had a significant linear trend at an unadjusted P < 0.01 (corresponding to t = 2.5) and regions in bold colors were significant following adjustment for multiple comparisons (false discovery rate-adjusted P < 0.05, t > 2.9). The graphs show the mean thickness (± s.e.) by genotype of the regions showing the Met158 ‘dosage’ effects, the right inferior frontal gyrus (top) and right superior/middle temporal gyrus (bottom).

