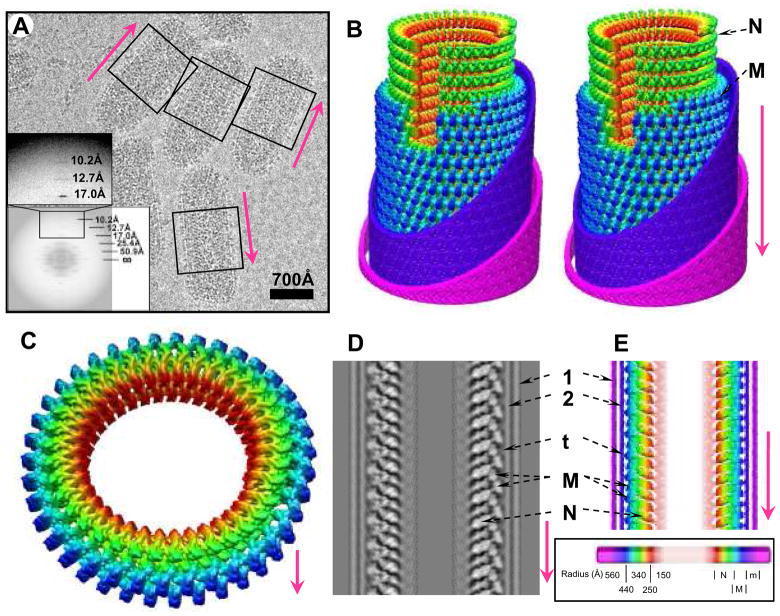
Figure 1. CryoEM of VSV virion and 3D reconstruction of its helical trunk.
(A) A typical cryoEM micrograph of VSV virions at 98,000x magnification. The trunk portion is marked by the boxes; inset, incoherent average of Fourier transforms of all raw images showing the layer lines. (B) Density map of the virion trunk. To enhance visual clarity and to show the interior, we computationally removed four turns of M, part of the membrane bilayer, incomplete subunits, and a 30° wedge. Nucleocapsid N and matrix M layers were displayed at a threshold of 1.15σ above the mean; envelope densities were displayed at a threshold of 0.1σ above the mean. (C) A complete repeat of the N and M helices, featuring 75 helical asymmetric units in two turns. (D) The central, vertical slice (17.3Å thick) in the density map and (E) a radially color-coded surface representation of a central slab (23Å thick). 1 and 2: outer and inner leaflets of the phospholipid bilayer envelope; t: putative cytoplasmic tail of G; M: matrix protein; N: nucleoprotein. Inset: Coloring scheme -- maps in all panels are colored according to radial distance as depicted in the scale bar. N: Nucleoprotein (red to green); M: Matrix protein (cyan to blue); e: envelope membrane (violet to pink). In this and the following figures, the arrow in every panel denotes the directionality (tip to trunk) of virions along the axis of the helix or of parts as they would be in the virion.

