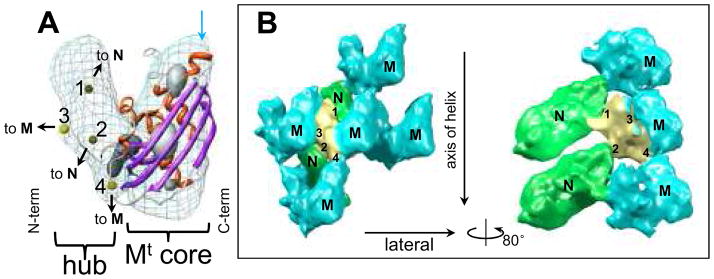
Figure 2. In situ structure of the full length M matrix protein.
(A) Fit of the crystal structure (ribbon) of the C-terminal core domain MCTD (right part) of M into the corresponding density map (mesh, contoured at 1.15σ above the mean), taken from the cryoEM map. The α helices are shown in red and β sheets in purple. The numbered yellow spheres in the left part of the density map mark the positions of the four contact points on the “M-hub” domain. The highest density regions of the cryoEM density are shown as gray shaded surface by contouring at 3.0σ above the mean. (B) Left: four adjacent M (cyan) with two N (green) subunits in the neighborhood of one M with its M-hub in yellow. The contact points on the M-hub that mediate interactions with M and N are labeled 1–4. The volume is contoured at 1.0σ. Right: by turning the left panel 80° around the vertical axis and removing the frontal M subunit, the interaction between N and M is illustrated.

