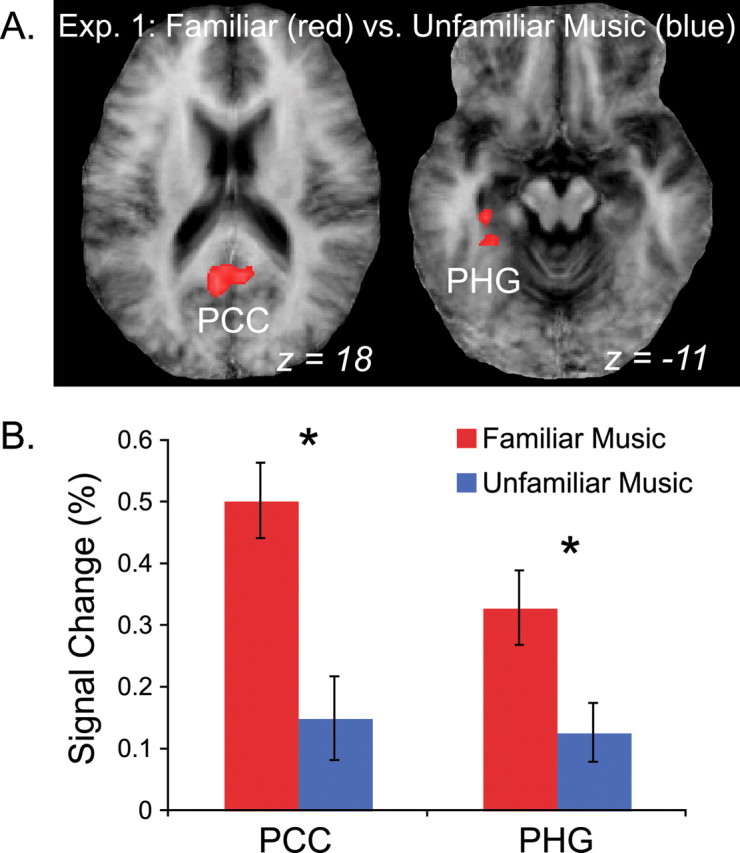
Figure 3.

BOLD response to FM and UM in experiment 1 (Exp. 1). A, Group activation maps showing brain areas significantly more active for FM than UM, including PCC and PHG. B, Results of an ROI analysis of the clusters in A. Signal change above baseline is plotted along the vertical axis. The PCC and PHG were significantly more active for FM than baseline (red), but signal in these same ROIs was not significantly greater than baseline during the UM condition (blue). Error bars reflect SEM. Asterisks indicate significant differences between FM and UM used to define the clusters (*p < 0.005).
