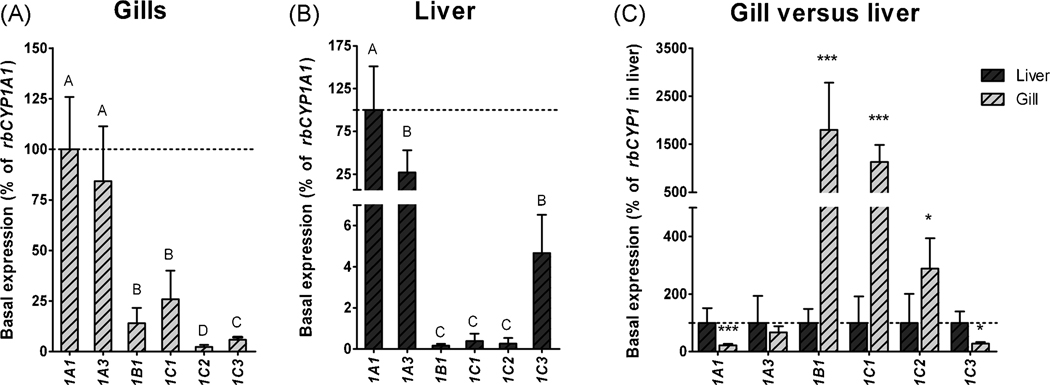
Figure 4.
Relative levels of rbCYP1A1 rbCYP1A3 rbCYP1B1 rbCYP1C1 rbCYP1C2, and rbCYP1C3 mRNA expression in gills (A), in liver (B), and in gills relative to liver (C) in unexposed rainbow trout (basal expression). Basal mRNA expression was calculated as a percentage of rbCYP1A1 mRNA expression in gills or liver (% of mean rbCYP1A1), or for each of the rbCYP1s in liver (% of mean rbCYP1 in liver). EF1α was used as reference gene. The dotted lines indicate 100%. Statistically significant differences between levels of rbCYP1 transcripts within a tissue were examined by one-way ANOVA followed by Tukey’s post hoc test and are shown by different letters. Statistically significant differences between transcript levels in gills and liver were determined by t-test with the Welch correction and are shown by stars (*** = p<0.001 and * = p<0.05), and n=5–6.

