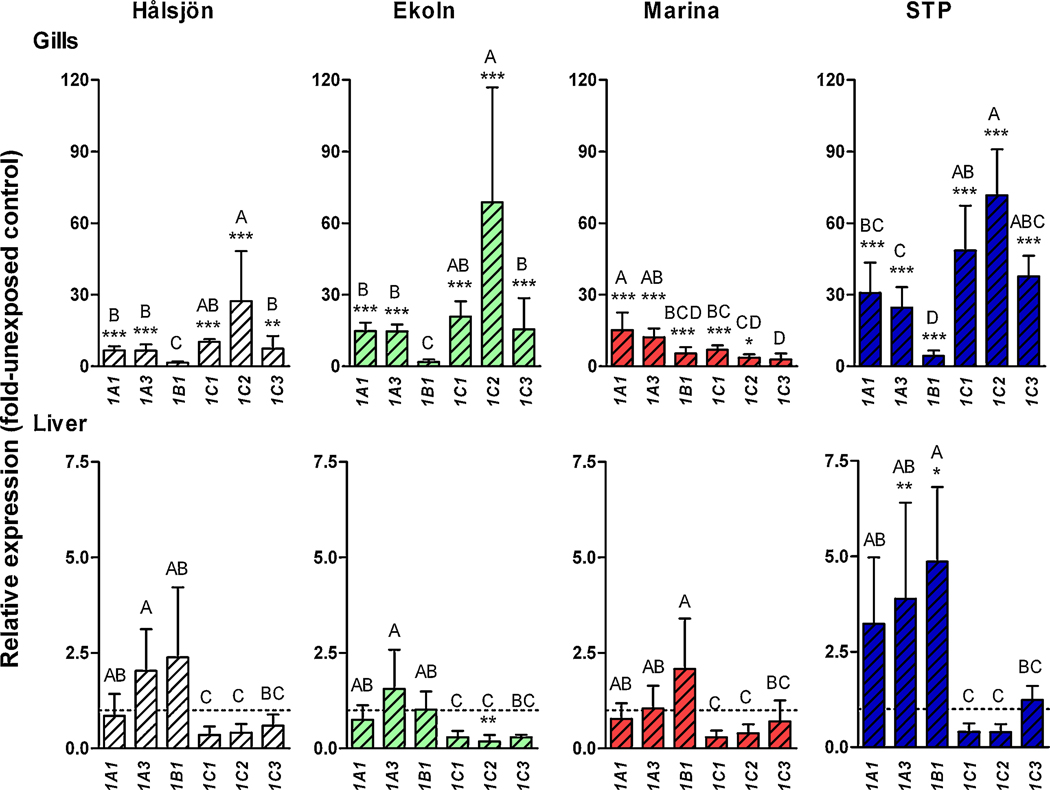
Figure 6.
Relative mRNA expression patterns of rbCYP1A1 rbCYP1A3 rbCYP1B1 rbCYP1C1 rbCYP1C2, and rbCYP1C3 in gills (A) and liver (B) of environmentally exposed rainbow trout. Groups of 12 fish were exposed by two days of caging at four freshwater sites in the Uppsala region. Calculations were made using EF1α as the reference gene and the mean values of the different rbCYP1s in unexposed controls as calibrators. Statistically significant differences among the rbCYP1 genes at a caging site were examined by one-way ANOVA followed by Tukey’s post hoc test and are shown by different letters (p<0.05). Statistically significant differences compared with the unexposed control were examined by one-way ANOVA followed by Bonferroni's post hoc test for selected pairs and are shown by stars (*** = p<0.001, ** = p<0.01, and * = p<0.05) and n=5–6.

