
Figure 1.
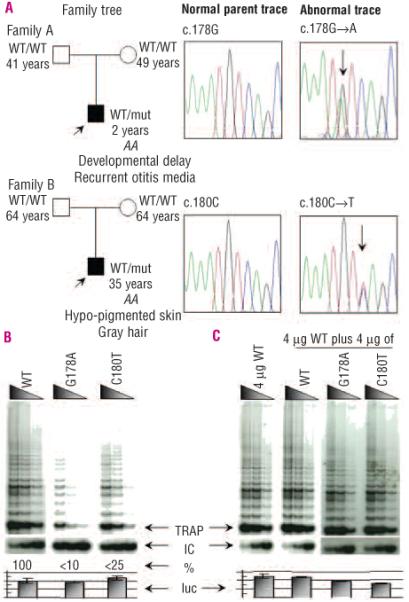
TERC mutation identification and analysis for Families A and B. A. Sequence traces depicting the normal and abnormal heterozygous TERC traces of G178A and C180T for families A and B, respectively. Age (years), TERC allele status (WT: as published TERC sequence; mut: nucleotide substitution as indicated in the sequence trace) and relevant family clinical history are indicated in the family trees in which the index cases (black squares) are indicated by an arrow and the parents appear asymptomatic (white squares or circles). B. Reconstituted TRAP assays showed that G178A and C180T reduce in vitro telomerase activity to less than 10% and 25% of WT control levels, respectively. C. In mixing experiments, activity did not drop below 50% of WT activity, suggesting no dominant negative effect for these two de novo heterozygous TERC mutations. The arrows denote the start of the TRAP ladder, the corresponding internal control (IC), the amount of activity in relationship to the WT TRAP control (%) and the levels of luciferase (luc) to control for the corresponding TRAP experiment. Serial dilutions of each transfected lysate were assayed as described in the methods section.