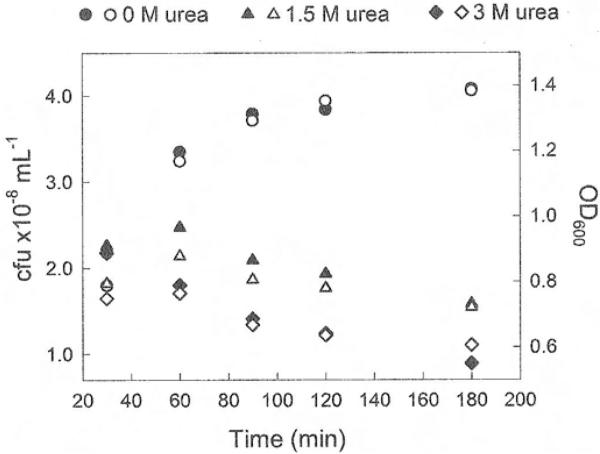
Fig. 7.2.
Cell viability. Change in the viability of the host cells as a function of the time of incubation in 0 M, 1.5 M, and 3 M urea. The viability was quantified by measuring the number of cells capable of forming colonies (left axis, closed circles) and optical density at 600 nm (right axis, open symbols).

