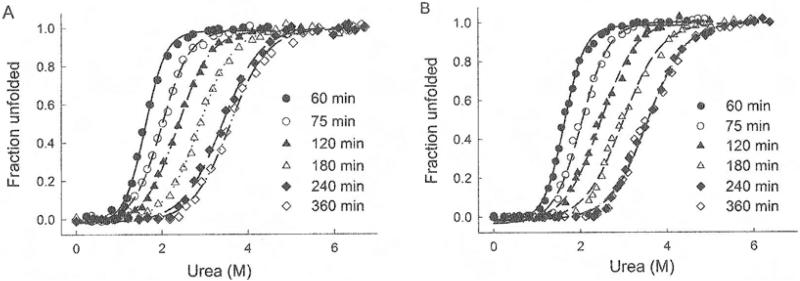
Fig. 7.4.
Urea titrations of FlAsH-labeled protein in vitro as a function of the incubation time (monitored by Trp fluorescence): (A) tetra-Cys CRABP and (B) P39A tetra-Cys CRABP. The actual urea concentration was determined by measuring the refractive index, and data are curve-fit to a two-state model. (Reproduced from Ref. (12) with permission from Willey InterScience.)

