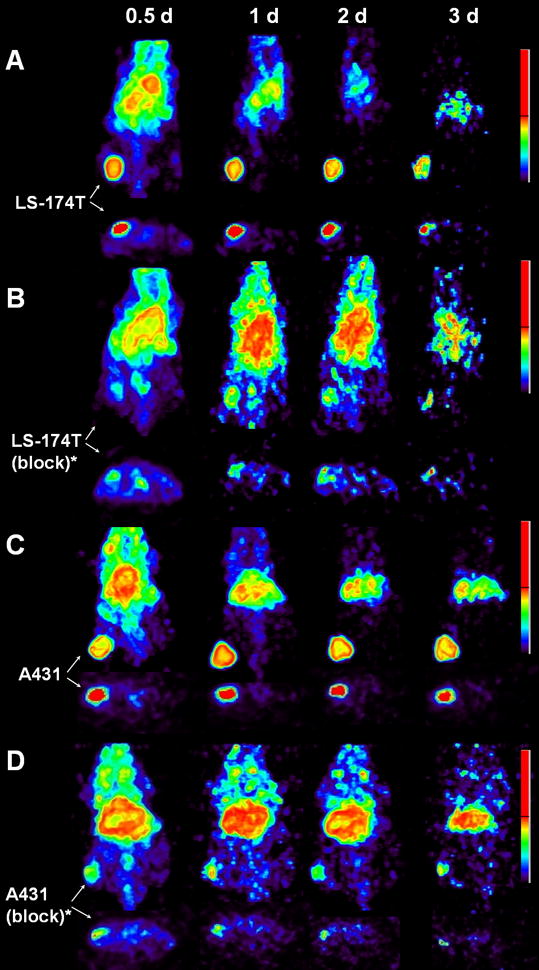
Figure 3.

Representative reconstructed and processed maximum intensity projections (top panel) and transverse slices (bottom panel) of female athymic (NCr) nu/nu mouse bearing human colorectal carcinoma LS-174T (3A and 3B) and human epidermoid carcinoma A431 tumor xenografts (3C and 3D). Mice represented in 3A and 3C were injected i.v. via tail vein with 1.8–2.0 MBq of 86Y-CHX-A″-DTPA-panitumumab, and mice represented in 3B and 3D were co-injected i.v. via tail vein with 1.8–2.0 MBq of 86Y-CHX-A″-DTPA-panitumumab and 0.1 mg Panitumumab for blocking HER1. The tumors are indicated with a white arrow. The scale represents % maximum and minimum threshold intensity.
*Receptor blocking studies were performed by co-injecting 0.1 mg panitumumab with the radiotracer.
