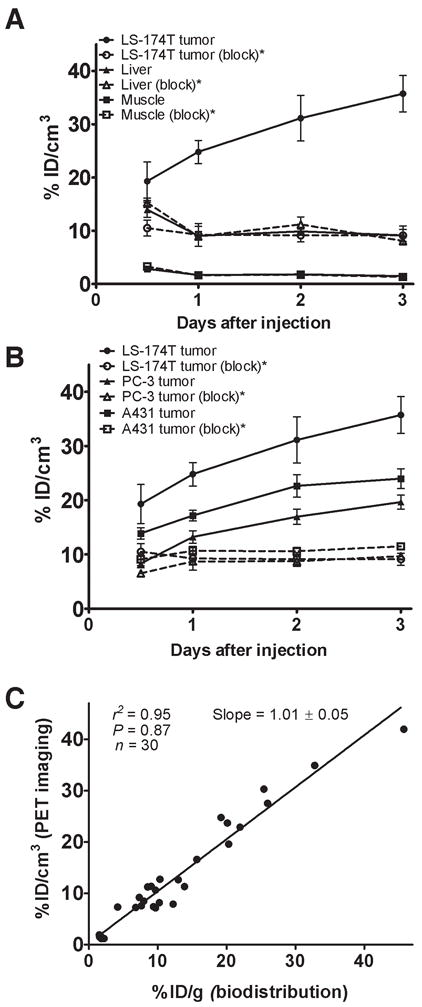
Figure 4.

(A) Time-activity curve and uptake values of 86Y-CHX-A″-DTPA-panitumumab in selected organs of female athymic (NCr) nu/nu mice bearing human colorectal carcinoma LS-174T xenografts assessed through quantitative small animal PET imaging. (B) Comparative time-activity curves of 86Y-CHX-A″-DTPA-panitumumab in female athymic (NCr) nu/nu mice bearing LS-174T, A431 and PC-3 tumor xenografts. (C) Correlation between organ % ID/g values assessed through in vivo biodistribution studies and quantitative small animal PET imaging. All uptake values derived from PET studies are expressed as % ID/cc. Data represent the mean value ± SEM from three determinations.
*Receptor blocking studies performed by co-injecting 0.1 mg panitumumab with the radiotracer.
