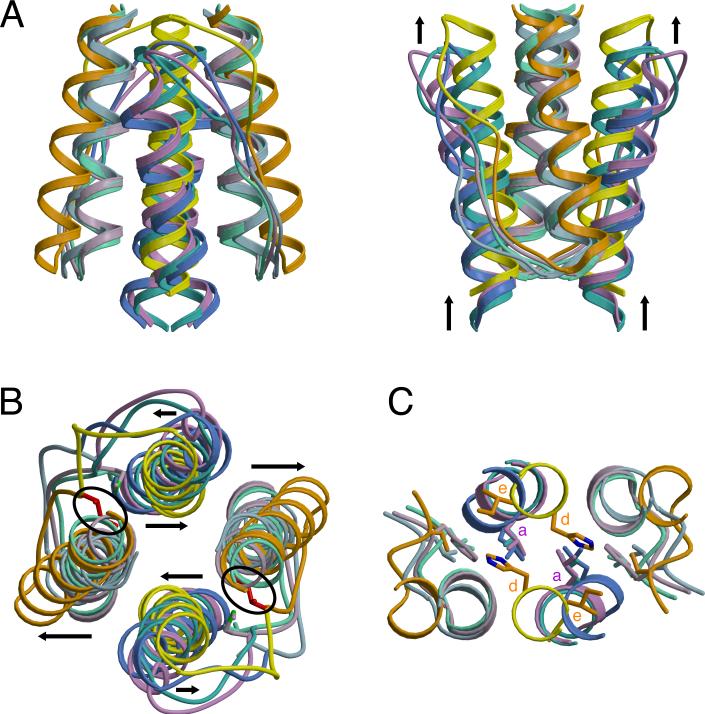
Figure 4. Superposition of HAMP Structures Reveals Two Distinct Conformations for Providing Different Signals to Downstream Domains.
Ribbon presentation of HAMP superpositions in (A) side and (B) top views displaying differences in helix orientation between overlapping HAMP1, HAMP3, and Af1503 (AS1: light green, AS2: turquoise) helices and distinct conformation of HAMP2 (AS1: orange, AS2: yellow) with offset helices, change in helix crossing angles (black arrows), and the inserted HR2 (I88: red) residue (black circle). Note the vertical displacement of AS2 relative to AS1. (C) Distal region of HAMP domains where signal output is directly linked to the conformation of AS2. His111 (HAMP2) occupies a typical “d” position, with the analogous residue in other HAMPs (L55: HAMP1, L155: HAMP3, L326: Af1503) holding an “a” position, in which they interact with hydrophobic residue 1 (HR1) of the connector.

