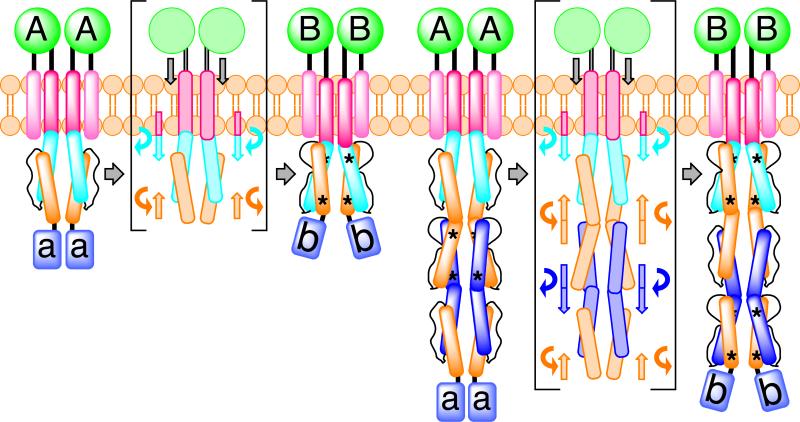
Figure 9. Model for HAMP Domain Signal Transduction.
Schematic of a ligand dependent, two-state (A and B) HAMP domain signal transduction model highlighting the movement and rotation of helices in a canonical HAMP system and a poly-HAMP system. In the poly-HAMP system successive AS1 helices are contiguous with the preceding AS2 helices. HAMP domain structural rearrangements correspond to a change in helical register, helix-helix crossing angle, and helix rotation. Asterisks denote stutters within HAMP domains. Signal input is shown as a symmetric and downward piston-like displacement of transmembrane helix 2 (TM2), but both an asymmetric displacement or a helical rotation of TM2 would likely lead to the same conformational changes within HAMP domains.

