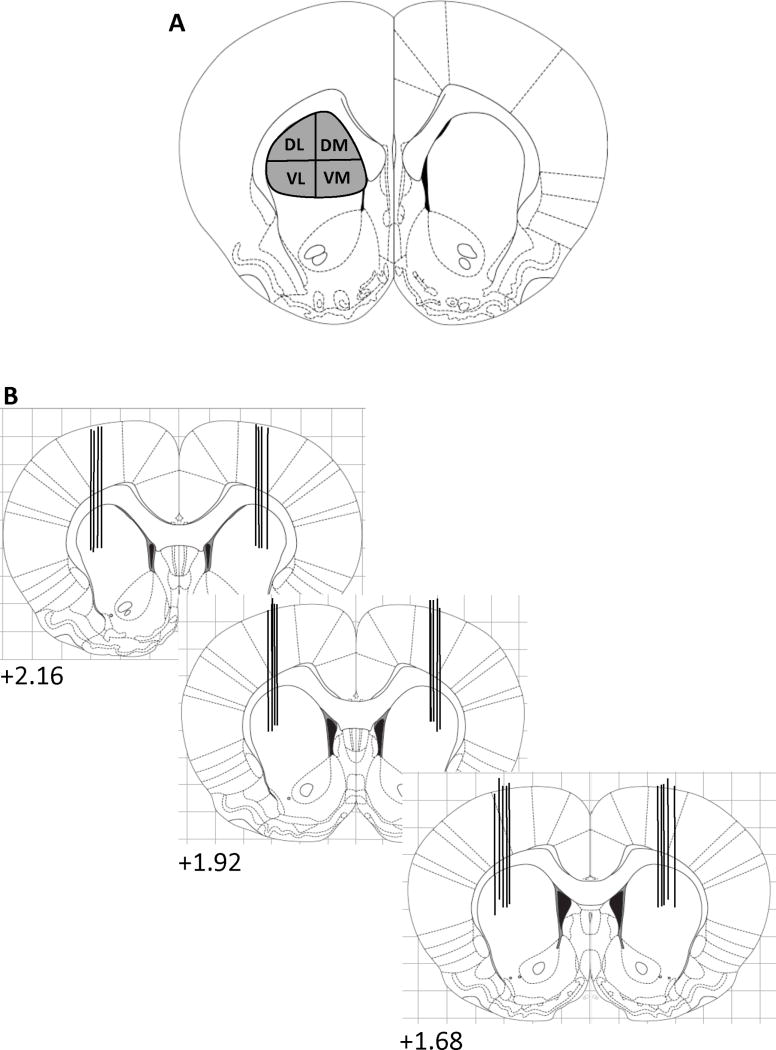
Figure 1.
Schematic diagram of the four sub-regions in rostral (AP+ 1.68) CPu used for autoradiogram analysis of mRNA expression in the patch and matrix compartments (A) and the approximate locations of the microinjection needle tips (B). The numbers indicate the millimeters anterior to bregma (Paxinos and Watson, 2005). DL, dorsolateral, DM, dorsomedial, VL, ventrolateral, VM, ventromedial (Adapted from Adams et al., 2001 and Gonzalez-Nicolini et al., 2003).

