
Figure 4. Circadian and homeostatic regulation of performance.
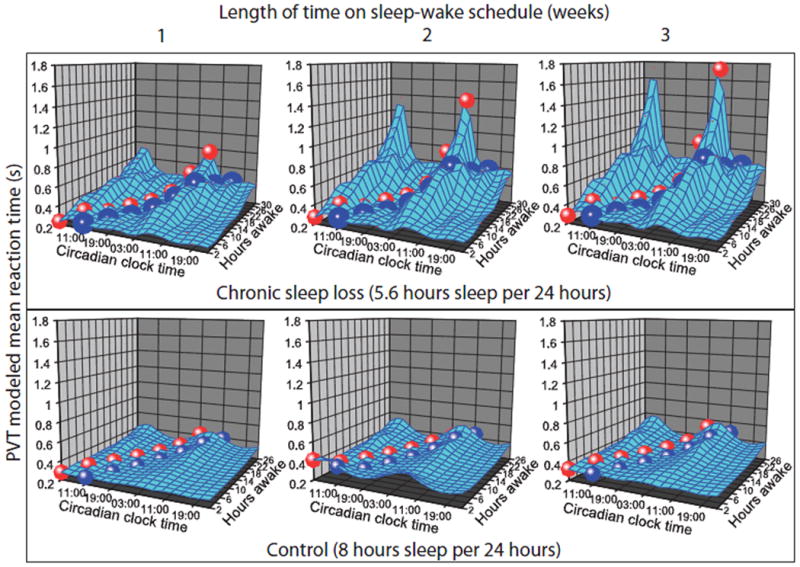
Mixed-effect statistical model predictions of PVT mean RT data at each combination of circadian phase and length of time awake within each week on the FD protocol are shown. Within each week of the chronic sleep loss protocol (top row), circadian amplitude increased with longer consecutive hours awake. Across weeks (left-to-right within each row), there was a disproportionate deterioration of performance during the late circadian night across three weeks of chronic sleep loss. Projected trajectories demonstrate the combination of consecutive hours awake and corresponding circadian time when individuals awaken at their normal entrained circadian time (blue path) and when they awaken two hours prior to the melatonin peak (red path) as may occur during jet leg or night shift schedules. The cumulative cost of chronic sleep loss is most pronounced during these conditions of circadian misalignment. The 85% average increase in predicted mean RT in the control condition between 2 hours awake during the circadian “day” and 26 hours awake during the circadian “night” is not apparent at this scale.