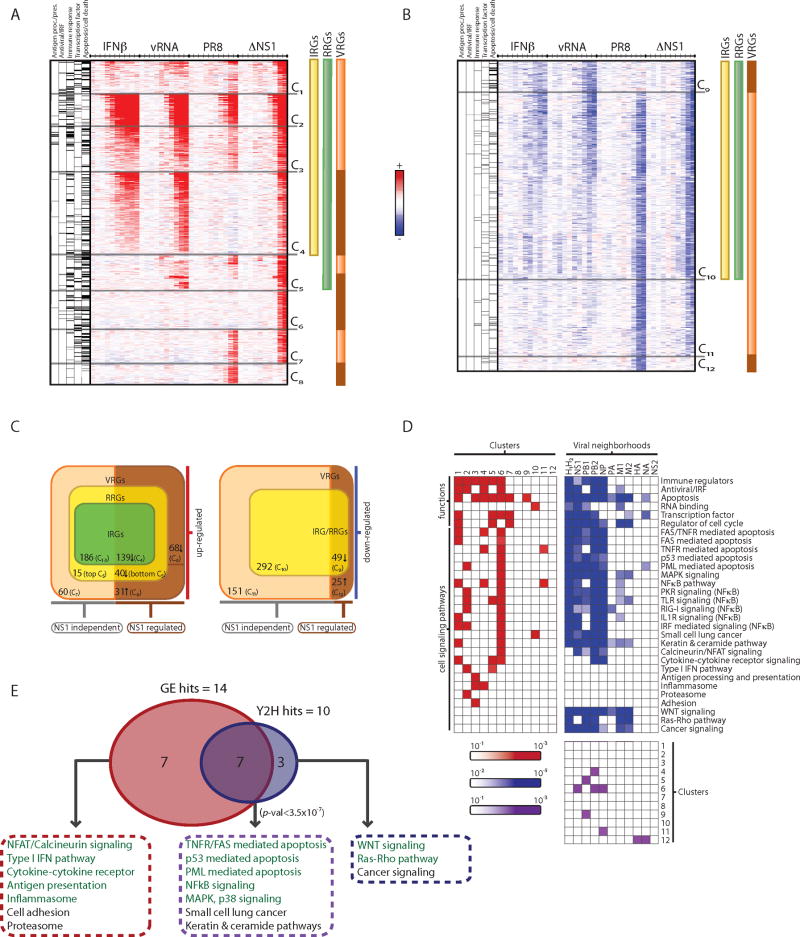
Figure 3. Functional decomposition of transcriptional responses to influenza infection identifies viral-specific gene regulation.
(A, B) Gene expression changes in HBECs in response to IFNβ (IRGs, yellow bar), vRNA (RRGs, green bar), wild type influenza (PR8) and mutant ΔNS1 virus (VRGs, orange bar; genes differentially regulated by NS1, brown bar) at 10 time points (.25, .5, 1, 1.5, 2, 4, 6, 8, 12, 18 hours, tick marks). Upregulated (A, red) and downregulated (B, blue) genes, relative to the expected level from mock-treated cells, were grouped into 12 clusters (C1-C12). Left columns denote gene membership in five major functional categories (black lines, category is enriched in cluster; grey lines, category is not enriched in cluster). (C) Venn diagrams indicate number of members in each class of regulated genes and their dependence on NS1 (bottom), within the subset of upregulated (left) and downregulated (right) genes. (D) Functional and pathway annotation of expression clusters and interaction neighborhoods. Shown are the functional categories and pathways (rows) enriched in each of the 12 expression clusters (red, left matrix) and interaction neighborhoods (H1 and H2) of each viral protein (blue, right matrix). Bottom matrix shows the significant overlaps (purple) between expression clusters (1-12, rows) and viral neighborhoods (columns). (E) Enrichment analysis identifies pathways that are over-represented in the influenza physical network (10 pathways, blue) and in transcriptional responses (14 pathways, red), with an overlap of 7 pathways enriched in both (purple, P <3.5×10⁻⁷). Pathways chosen for functional follow-up assays are colored in green.

