
Fig. 8.
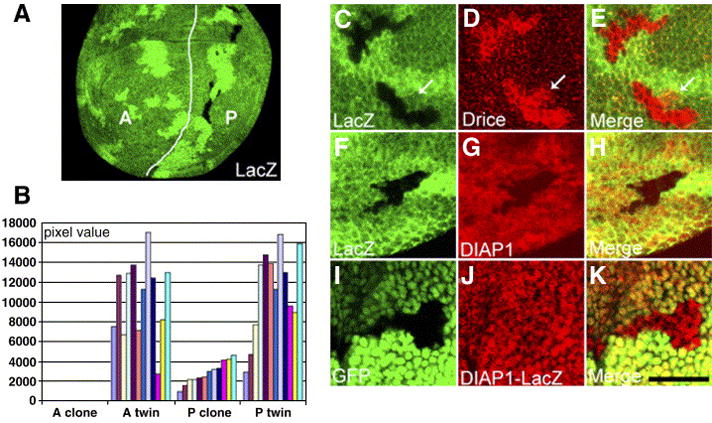
dco mutant clones are rescued by inhibition of caspases and exhibit increased Drice activation and decreased DIAP1 protein, but not DIAP-lacZ. dco null (dcole88) mutant clones were generated in an en-Gal4/UAS-p35 background and are marked by the absence of lacZ staining (green; A,C–H) or GFP (green; I–K) as indicated. (A) dco clones are found in the posterior (P) compartment where p35 is expressed by en-Gal4, but the anterior (A) clones are not observed. The white line marks the AP boundary. The presence of the twins at the anterior indicates that mitotic recombination had been induced. (B) Quantification of the dco clone/twin area. The pixel value of each bar represents the total area of clones or twins in A or P in one disc, and 12 discs containing a total of more than 30 individual clones were analyzed. The difference between the areas of A twins (average: 10451 pixels/disc) and P twins (average: 11138 pixels/disc) is not statistically significant (p>0.20 by the Mann-Whitney test). The average size of the P clones (2855 pixels/disc) is 25.6% of the size of the P twins. (C–E) Active Drice (red) is elevated in dco clones. Occasionally active Drice is observed adjacent to the clones (arrows). (F–H) DIAP1 protein (red) is decreased in dco clones. (I–K) dco clones marked by the absence of GFP were generated in a DIAP-lacZ background (thi5c8). DIAP-LacZ (red) is not altered in the clones. Scale bar: 20μm.