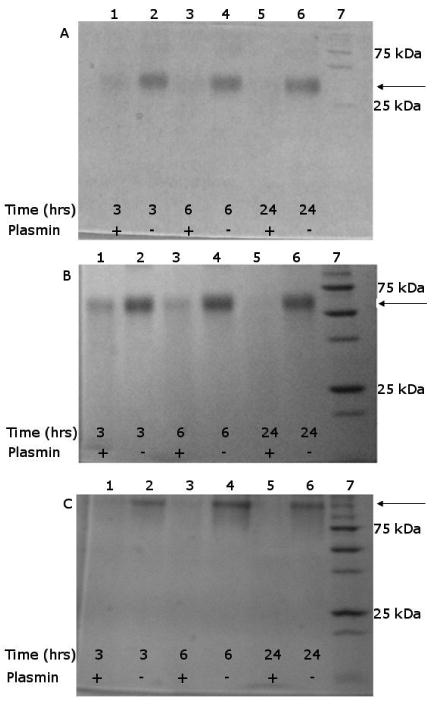
Figure 5.

SDS-PAGE analysis of degradation by plasmin shows that the PPCAs are digested; bands for full-molar mass protein decrease in intensity over time, when plasmin is present. A) K8-30 B) K8-60 and C) K8-120 PPCA. In A, B, and C, Lane 1: (+) plasmin, 3 hours; Lane 2: (-) plasmin, 3 hours; Lane 3: (+) plasmin, 6 hours; Lane 4: (-) plasmin, 6 hours; Lane 5: (+) plasmin, 24 hours; Lane 6: (-) plasmin, 24 hours; Lane 7: molecular weight marker. Arrows mark the peak with the full PPCA molar mass.
