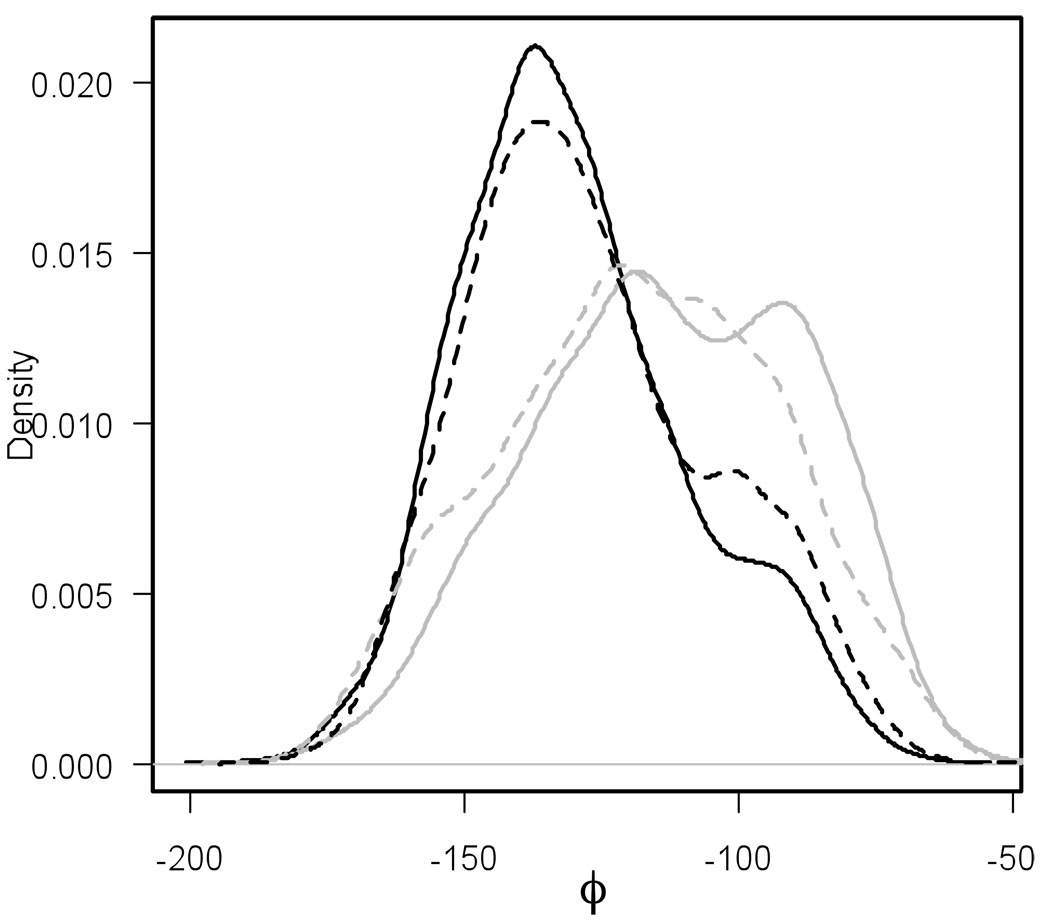
Figure 6.
Distributions of ϕ angle of the first hitting point conformations of the region of image X5 (located at ψ = 80°): distributions observed in a long MD simulation for conformations arriving to the hypersurface at X5 from the hypersurface of X4 (black solid), or from that of X6 (gray solid). Distributions sampled on the Milestone M4→5 (black dashed) and the Milestone M6→5 (gray dashed).

