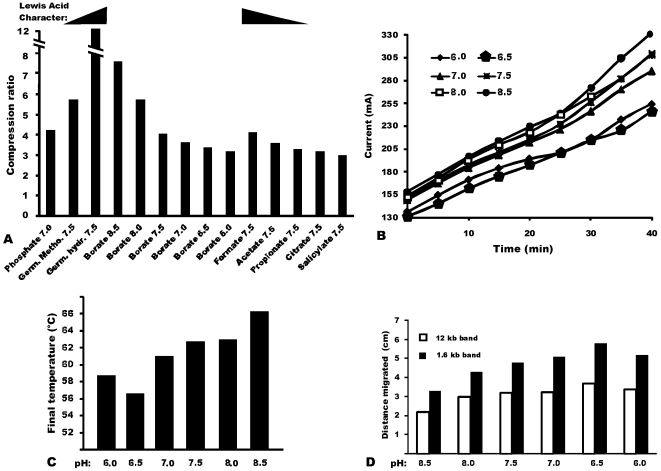
Figure 3. Compression ratios for anions tested and comparison of borate buffers at different pHs.
(a) Compression ratios for various anions and borates at different pH. For the similar germanium compounds, the ramp above their data depicts that the hydroxide is expected to have the greater Lewis acid character. For the incremental linear chain carboxylic acid series (formate, acetate, propionate), the ramps above their data similarly depict that formate has the highest, and acetate the second-highest, expected Lewis acid character among this series. The ramps do not pertain to the other histogram data. (b) Conductivity of the buffer as a function of time, measured as current at constant voltage of 350 V. (c) Temperature in the anodic chamber as a function of time. (d) Electrophoretic run speed, represented as the distance traveled from the well by 12 kb and 1.6 kb bands in an 80 min run.

