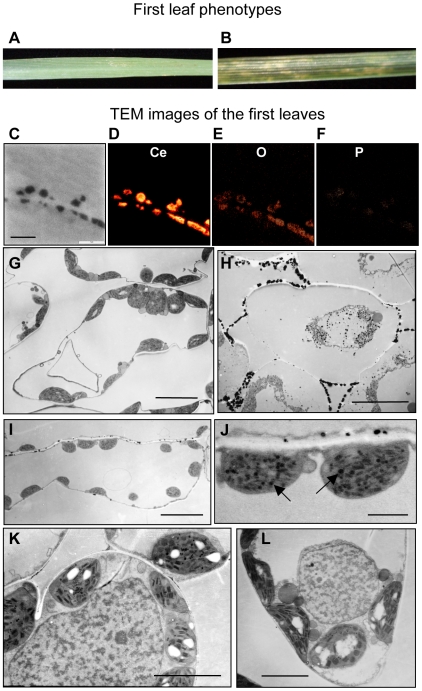
Figure 5. Transmission electron microscopic (TEM) observations of the intracellular structure of the 1st (lowest) leaves in the synthetic hexaploid wheat lines.
Each plant was grown at 23°C for 3 weeks, and the leaves were pre-treated with CeCl3 for ROS detection. A–B) The 1st leaf for TEM observation in wild type (A) and type III necrosis line (B). C–F) Elemental mapping using energy-filtered transmission electron microscopy. Dark cerium-reacting deposits were observed in TEM analysis (C). Each orange fluorescence indicates localization of cerium, oxygen and phosphorus in (D), (E) and (F), respectively. The bar in (C) indicates 1 µm. G-L) Mesophyll cells in the 1st leaves of the WT (G, L) and type III necrosis (H, I, J, K) lines. Arrows in (J) indicate oil droplets. Bars indicate 10 µm (G, H and I), 5 µm (K and L) and 2 µm (J).

